How much does an hourly worker earn on average in Europe if the annual salary is translated into an hourly equivalent? A map published in 2026 by Voronoibased on official data from Eurostat and the OECD, places Spain in an intermediate position within Europe, but below the community reference. Of course, the data displayed corresponds to the average annual full-time salary in 2024.
In the case of Spain, the average annual full-time salary in 2024 was 33,700 euros. If we make an estimate at this salary, knowing that with the current working day of 40 hours a week there are 2,080 hours a year, the result is 16.2 euros per hour.
For its part, in the European Union (the 27 that make it up), the average rises to 39,808 euros, which is equivalent to 19.1 euros per hour under the same equation. That is, in Spain people charge 2.9 euros less per hour than the average community level.
Where is Spain in Europe?
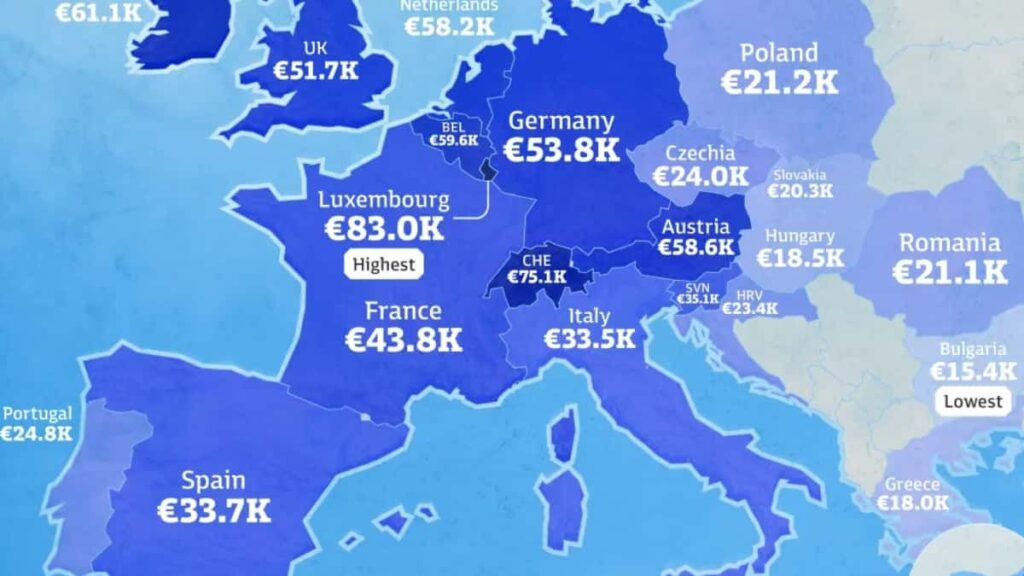
With the countries on the map, Spain appears in 16th place out of 31 for average annual salary (taking into account that these are data from 2024). This means that we remain in the middle of the table, despite the fact that we are the fourth economy in the European Union (EU) by GDP volume and far from the leading group in northern and western Europe.
Some data that we can obtain are:
- France: 43,790 euros per year, about 21.1 euros/hour, clearly above Spain.
- Portugal: 24,818 euros per year, around 11.9 euros/hour, at the bottom of the ranking.
- Italy: 33,523 euros per year, about 16.1 euros/hour, practically on par with Spain.
| Position | Country | Average annual salary 2024 (€) | €/hour equivalent (approx.) |
|---|---|---|---|
| 1 | Luxembourg | 82,969 | 39.9 |
| 2 | Iceland | 77,189 | 37.1 |
| 3 | Swiss | 75,062 | 36.1 |
| 4 | Denmark | 71,565 | 34.4 |
| 5 | Norway | 64,029 | 30.8 |
| 6 | Ireland | 61,051 | 29.4 |
| 7 | Belgium | 59,632 | 28.7 |
| 8 | Austria | 58,600 | 28.2 |
| 9 | Netherlands | 58,248 | 28.0 |
| 10 | Germany | 53,791 | 25.9 |
| 11 | United Kingdom | 51,657 | 24.8 |
| 12 | Finland | 49,428 | 23.8 |
| 13 | Sweden | 46,525 | 22.4 |
| 14 | France | 43,790 | 21.1 |
| 15 | Slovenia | 35,133 | 16.9 |
| 16 | Spain | 33,700 | 16.2 |
| 17 | Italy | 33,523 | 16.1 |
| 18 | Malta | 33,499 | 16.1 |
| 19 | Lithuania | 29,104 | 14.0 |
| 20 | Cyprus | 27,611 | 13.3 |
| 21 | Estonia | 26,546 | 12.8 |
| 22 | Portugal | 24,818 | 11.9 |
| 23 | Czechia | 23,998 | 11.5 |
| 24 | Croatia | 23,446 | 11.3 |
| 25 | Latvia | 22,262 | 10.7 |
| 26 | Poland | 21,246 | 10.2 |
| 27 | Romania | 21,108 | 10.1 |
| 28 | Slovakia | 20,287 | 9.8 |
| 29 | Hungary | 18,461 | 8.9 |
| 30 | Greece | 17,954 | 8.6 |
| 31 | Bulgaria | 15,387 | 7.4 |
The European countries that earn the most and the least
At the top of the map, Luxembourg stands out, with 82,969 euros per year, which is equivalent to about 39.9 euros/hour in the same calculation. In comparative terms, Luxembourg multiplies the Spanish hourly equivalent by 2.5.
Behind him appear Iceland (77,189 euros) and Switzerland (75,062 euros), while the Nordic and Western bloc once again dominates leading positions (Denmark, Norway, Ireland).
In the queue appear Bulgaria (15,387 euros), Greece (17,954 euros) or Hungary (18,461 euros), with hourly equivalents that move approximately between 7 and 9 euros per hour if the same conversion is applied. The pattern is the same, that is, the highest salaries are concentrated in the north and west, and the lowest in the south and east.
Nominal salary and purchasing power are not the same
When looking at salaries, we must look at another piece of information that is also important and helps us to have a more contextualized vision. This data is the purchasing power parity (PPP) or what is the same as “how much a salary really yields”.
This is where the OECD indicator of average annual salary comes in, which is expressed in US dollars converted by PPP, precisely to approximate comparisons between countries with different costs of living. The OECD itself defines this salary as the annual rate paid per full-time equivalent employee in the economy as a whole.
With this PPP criterion (2024 data from the file provided), Spain appears with 54,564 PPP dollars, compared to 94,447 in Luxembourg or 69,433 in Germany. In this way, the differential exists in nominal terms and also when adjusted for purchasing capacity, although the adjustment can change subtly between countries.